Music (artist) dashboard
If you sign in to the Console with a Music (artist) account, you get a different dashboard from Enterprise: analytics for your catalogue, not branch monitoring. Reach it at play.finetunes.app/artists/dashboard after Console sign-in.
That's the Enterprise HQ dashboard, a separate view for admins who manage playpoints. See HQ Dashboard tour.
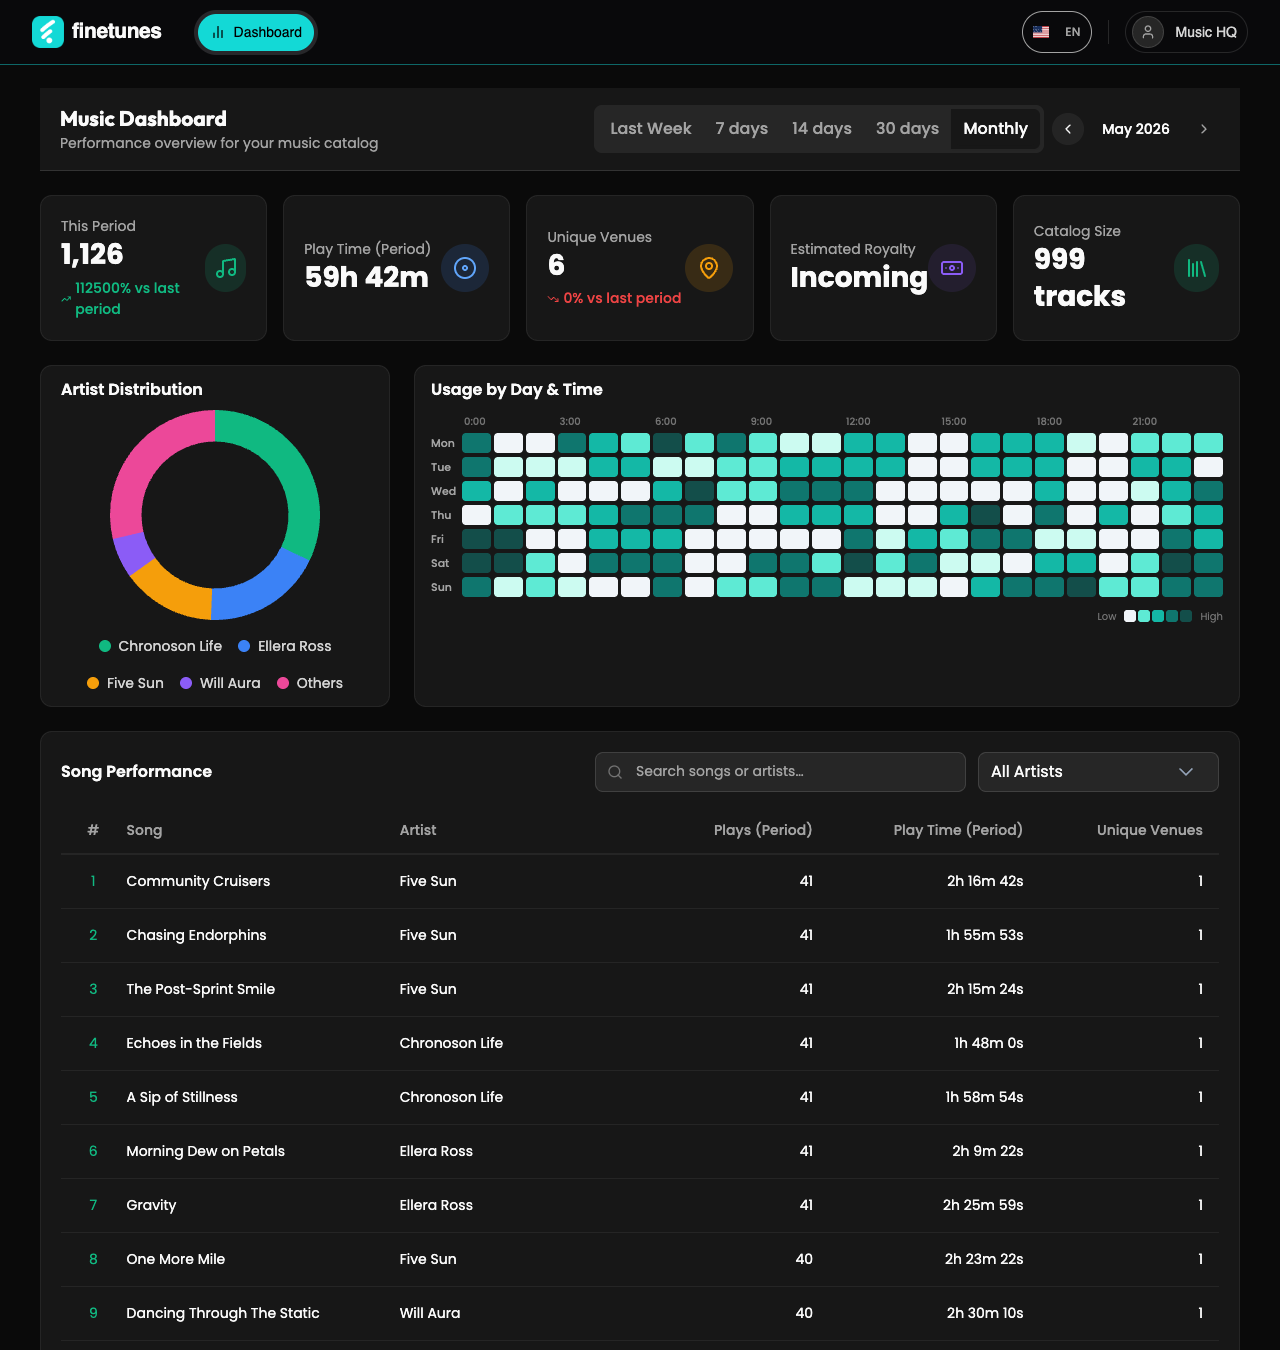 The Music dashboard for one month: headline numbers, the artist mix, listening hours, and the song table.
A walk through the Music dashboard: pick a month, read the numbers, search and filter songs, open a song.
Chapters: 0:00 Dashboard · 0:04 Pick a month · 0:18 Headline numbers · 0:25 Artist mix and hours · 0:31 Search songs · 0:37 Filter by artist · 0:44 Song detail
Pick the period
Every number on the page follows the period selector at the top right:
- Last Week, 7 days, 14 days, 30 days: a rolling window ending today.
- Monthly: one calendar month. Use the arrows next to the month name to step back or forward.
Headline numbers
| Card | What it shows |
|---|---|
| This Period | How many times your songs were played, with the change against the previous period. |
| Play Time (Period) | Total listening time across your catalogue. Marked beta. |
| Unique Venues | How many venues played your music. |
| Estimated Royalty | Placeholder for now. See the note below. |
| Catalog Size | How many tracks you have in finetunes. |
Artist mix and listening hours
- Artist Distribution splits the period's plays by artist. The biggest artists get their own colour; the rest are grouped as Others.
- Usage by Day & Time is a grid of weekdays by hour. The darker the cell, the more your catalogue was played at that hour. Use it to see whether your music lands in mornings, lunch, or evenings.
Song Performance
The table lists every song played in the period, most played first, with Plays (Period), Play Time (Period), and Unique Venues for each.
- Search by song or artist name.
- Filter by artist with the dropdown on the right.
- Change Songs per page at the bottom, and page through with the arrows.
Song detail
Click a song to open its detail panel for the same period:
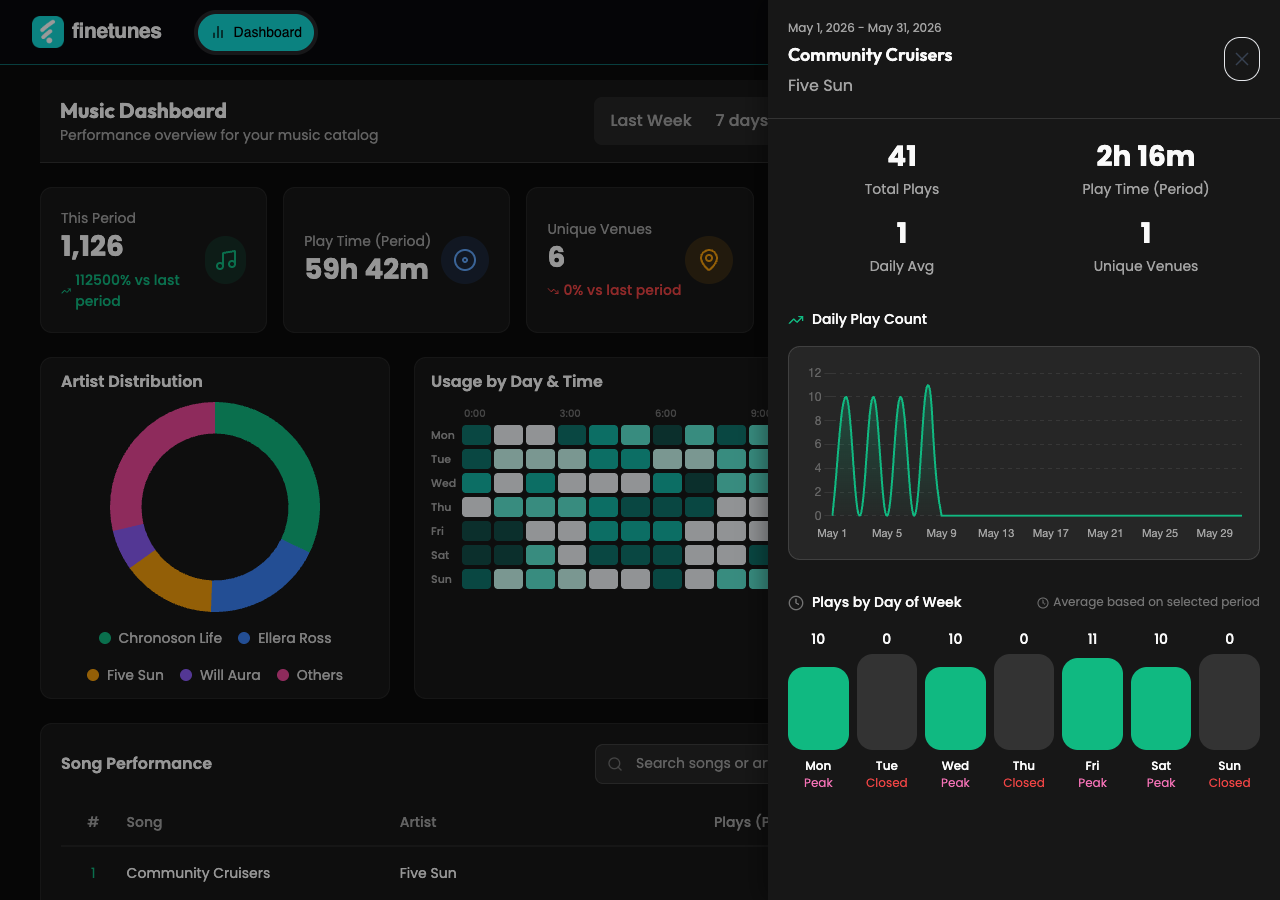 Song detail: totals at the top, plays per day, then plays by day of the week.
- Total Plays, Play Time (Period), Daily Avg, and Unique Venues.
- Daily Play Count: plays per day across the period.
- Plays by Day of Week: which weekdays the song is played on, marked Peak or Closed.
Close the panel with the × at its top right.
Estimated Royalty shows "Incoming" while the feature ships. Unique Venues shows a number, but its calculation is not final, so don't quote it yet. The changelog announces both when they are ready.
There's no branch, queue, or schedule management on the Music dashboard. It's analytics only.
Next
- Manage branches instead? HQ Dashboard tour →
- How to sign in? Console sign-in →